
As the complexity of a program increases, software developers need good debugging tools. The ideal debugging process is to identify how to reliably reproduce a problem in a development environment where you can experiment freely, and then create automated tests based on this. However, when the reproduction scenario itself is too complex or the kind of bugs that only occur randomly in production environments, the next best thing is to log in detail so that you can understand what the problem was later. In this post, we introduce the aiomonitor-ng tool we developed to make debugging complex asyncio programs easier.
Debugging asyncio applications has its own difficulties. When debugging in Python, the most frequently used tool is the stack trace, which shows where in the program an exception occurred. However, because multiple coroutine tasks in asyncio applications are executed concurrently, each with its own stack, it is necessary to observe not only the stack of the coroutine task in which a specific exception occurred but also the stacks of 'related' coroutine tasks to accurately determine whether the error was caused by another coroutine task. This becomes an even more important issue in situations where an external library used in my code implicitly creates a coroutine task and that coroutine task calls my code again. In addition, bugs such as coroutine task explosions that occur only in production environments and bugs where coroutine tasks that should continue to run quietly end up being terminated are difficult to catch, especially in development environments. These types of bugs are difficult to catch because they do not generate explicit exceptions and can only be inferred from post-logs.
aiomonitor is a production-level live debugging tool developed by asyncio core developers. If you wrap asyncio-based code in a monitor object, you can open a telnet session to a pre-configured TCP port outside of the process while the code is running, and using simple commands, you can view the list of coroutine tasks being executed by the event loop and the current status of individual stacks. In Backend.AI, this aiomonitor has already been applied, and each individual service process has its own debugging telnet port assigned. (Of course, for security reasons, only connections from localhost are allowed.) This has been a great help in debugging problems that occur only in production. However, debugging why a coroutine task dies due to an external library that is not code specific to Backend.AI still had limitations in terms of debugging by looking into aiomonitor at the moment the problem occurs.
So, we developed an extended version called aiomonitor-ng, where "ng" stands for next-generation. It features the following additions and improvements:
- Task creation tracker: For all running coroutine tasks, the momentary stack trace is preserved for each job that created the coroutine task (
asyncio.create_task()) to allow the entire chain of task creation to be tracked (ps,wherecommand). - Task termination tracker: Recently terminated coroutine tasks can be preserved and viewed up to a maximum of N, especially when one job cancels (
Task.cancel()) another job. The momentary stack trace of the cancellation trigger is also preserved to enable tracking of the entire cancellation chain (ps-terminated,where-terminatedcommand). - Persistent task marker: By default, to prevent memory leaks, recently terminated jobs are tracked up to a maximum of N. However, if specific jobs that must continue running throughout the application's lifespan are marked with a decorator, those jobs always preserve their termination logs, regardless of the history limit. They also provide a filtering function as an additional option in the termination log query command (
aiomonitor.task.preserve_termination_logdecorator). - Sophisticated terminal UI: We improved command-line processing, which was previously composed of a simple REPL (read-evaluate-print loop) based on handcrafted command parsing. We rewrote the aiomonitor server-side implementation to use Click and prompt_toolkit. We also developed a Telnet client that natively operates with asyncio to provide argument autocomplete, such as command and task ID.
Here are some screenshots of the actual usage:
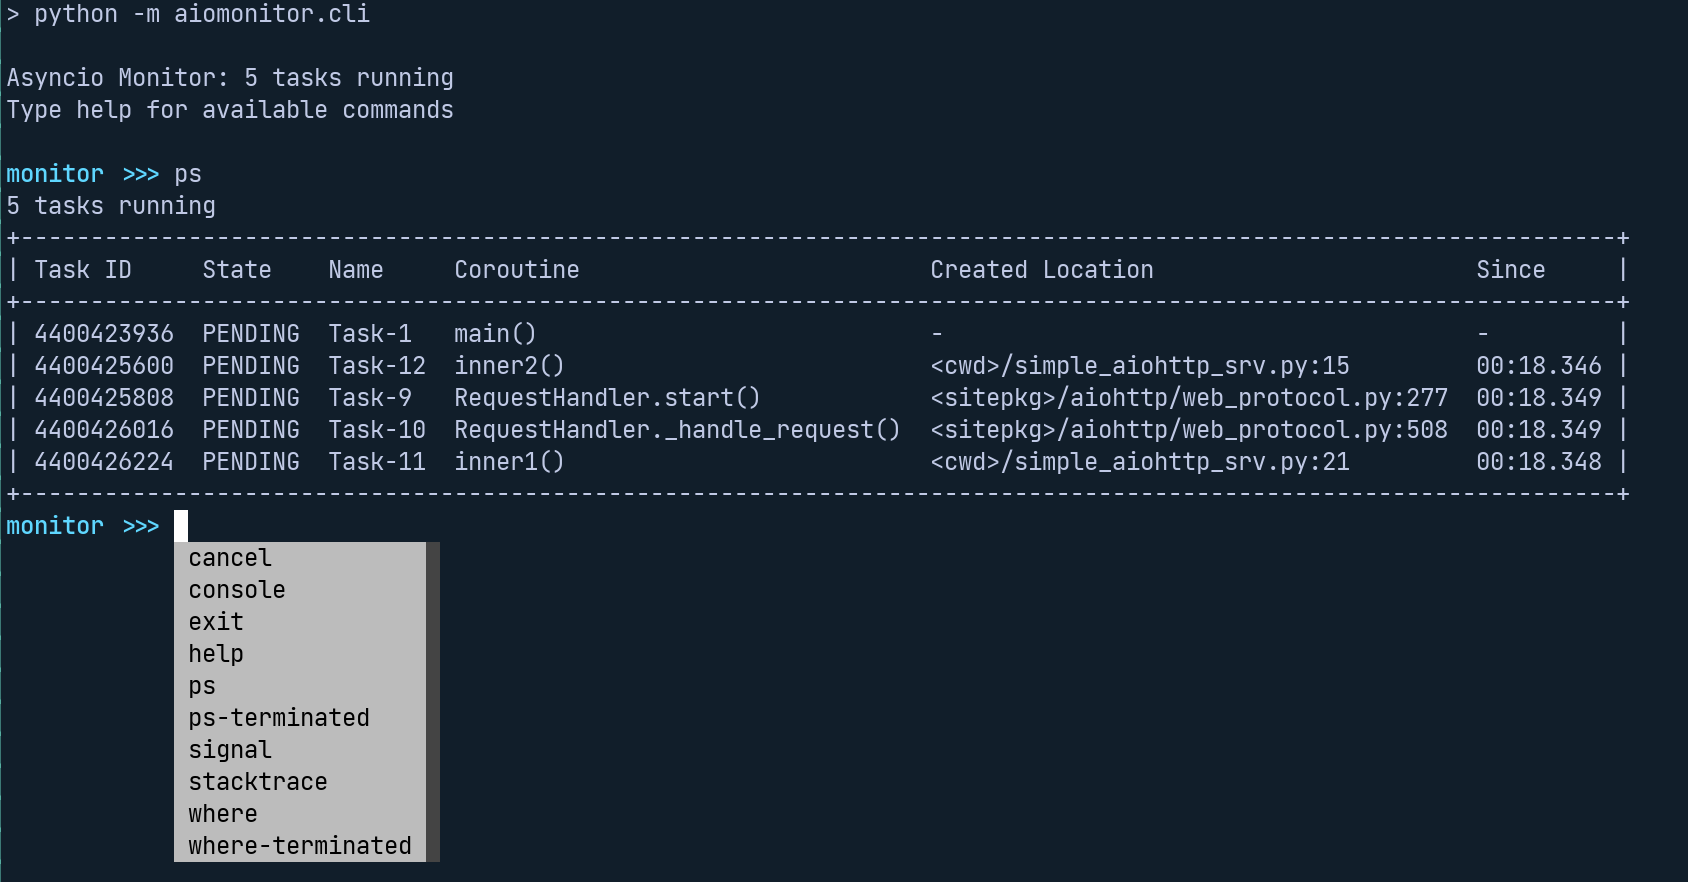
We successfully debugged resource leaks and performance degradation issues caused by excessive coroutine task creation from the grpcio library via callbacks, as well as issues where tasks monitoring events generated by the docker daemon would quietly terminate due to certain input message patterns. This prevented results of container creation or deletion tasks from being returned, causing system crashes.
We hope that readers who develop not only Lablup but also various Python asyncio applications can benefit from aiomonitor-ng for debugging in the future.
aiomonitor-ng can be installed via PyPI using the command pip install aiomonitor-ng, and it is open-sourced on my GitHub account for anyone to use and contribute.